From Data to Insights to Drive Sustainable Change in Philips’ Global Road Freight CO2e Emissions
As a company that owns business worldwide, Philips is also dedicated to operate sustainably and environment friendly. The company set a target to reduce its carbon footprint across the value chain in line with a 1.5°C global warming scenario. To achieve such goal, one of Philips’ focus is reviewing and improving the logistics processes. Following this strategy a dashboard that analyzes the logistics carbon emissions was establish. However, the analysis for road transportation logistics was still missing from the dashboard.
The outcome of the project “From Data to Insights to Drive Sustainable Change in Philips’ Global Road Freight CO2e Emissions” successfully filled in gap for a complete picture of Philips’ logistics carbon emissions. The new applications process and clean the raw input data, calculate emission using shipment records, and display the analysis results. These applications were integrated into the existing system and adopted an identical reload schedule. Finally, a new sheet, along with an addition section on the landing page, was created in the user interface, the Logistics Freight Dashboard, to present the road freight carbon emission statistics.
Judging from the performance of the latest design in this project, we applied the architecture to ocean freight-related applications as refinement and achieved a success. We recommend accepting the structure depicted in this document as a new standard to improve the efficiency and maintainability of the Philips’ logistics carbon emission analysis system.
System Design
Since we accepted road logistics data from all Philips’ departments as input, an environment that allows us processing, analyzing, and visualizing data in large quantities was needed. Furthermore, the environment had to also allow for integration with the existing system.Taking these into consideration, the Business Intelligence (BI) tool, Qlik Sense, was selected as the system environment.
Qlik Sense is a web-based BI tool that Philips is currently using across different groups for various intentions. The tool adapts a layered architecture, separating the database, the business processing procedure, and the presentation, i.e., the end user interface as three layers, as shown in the figure below.
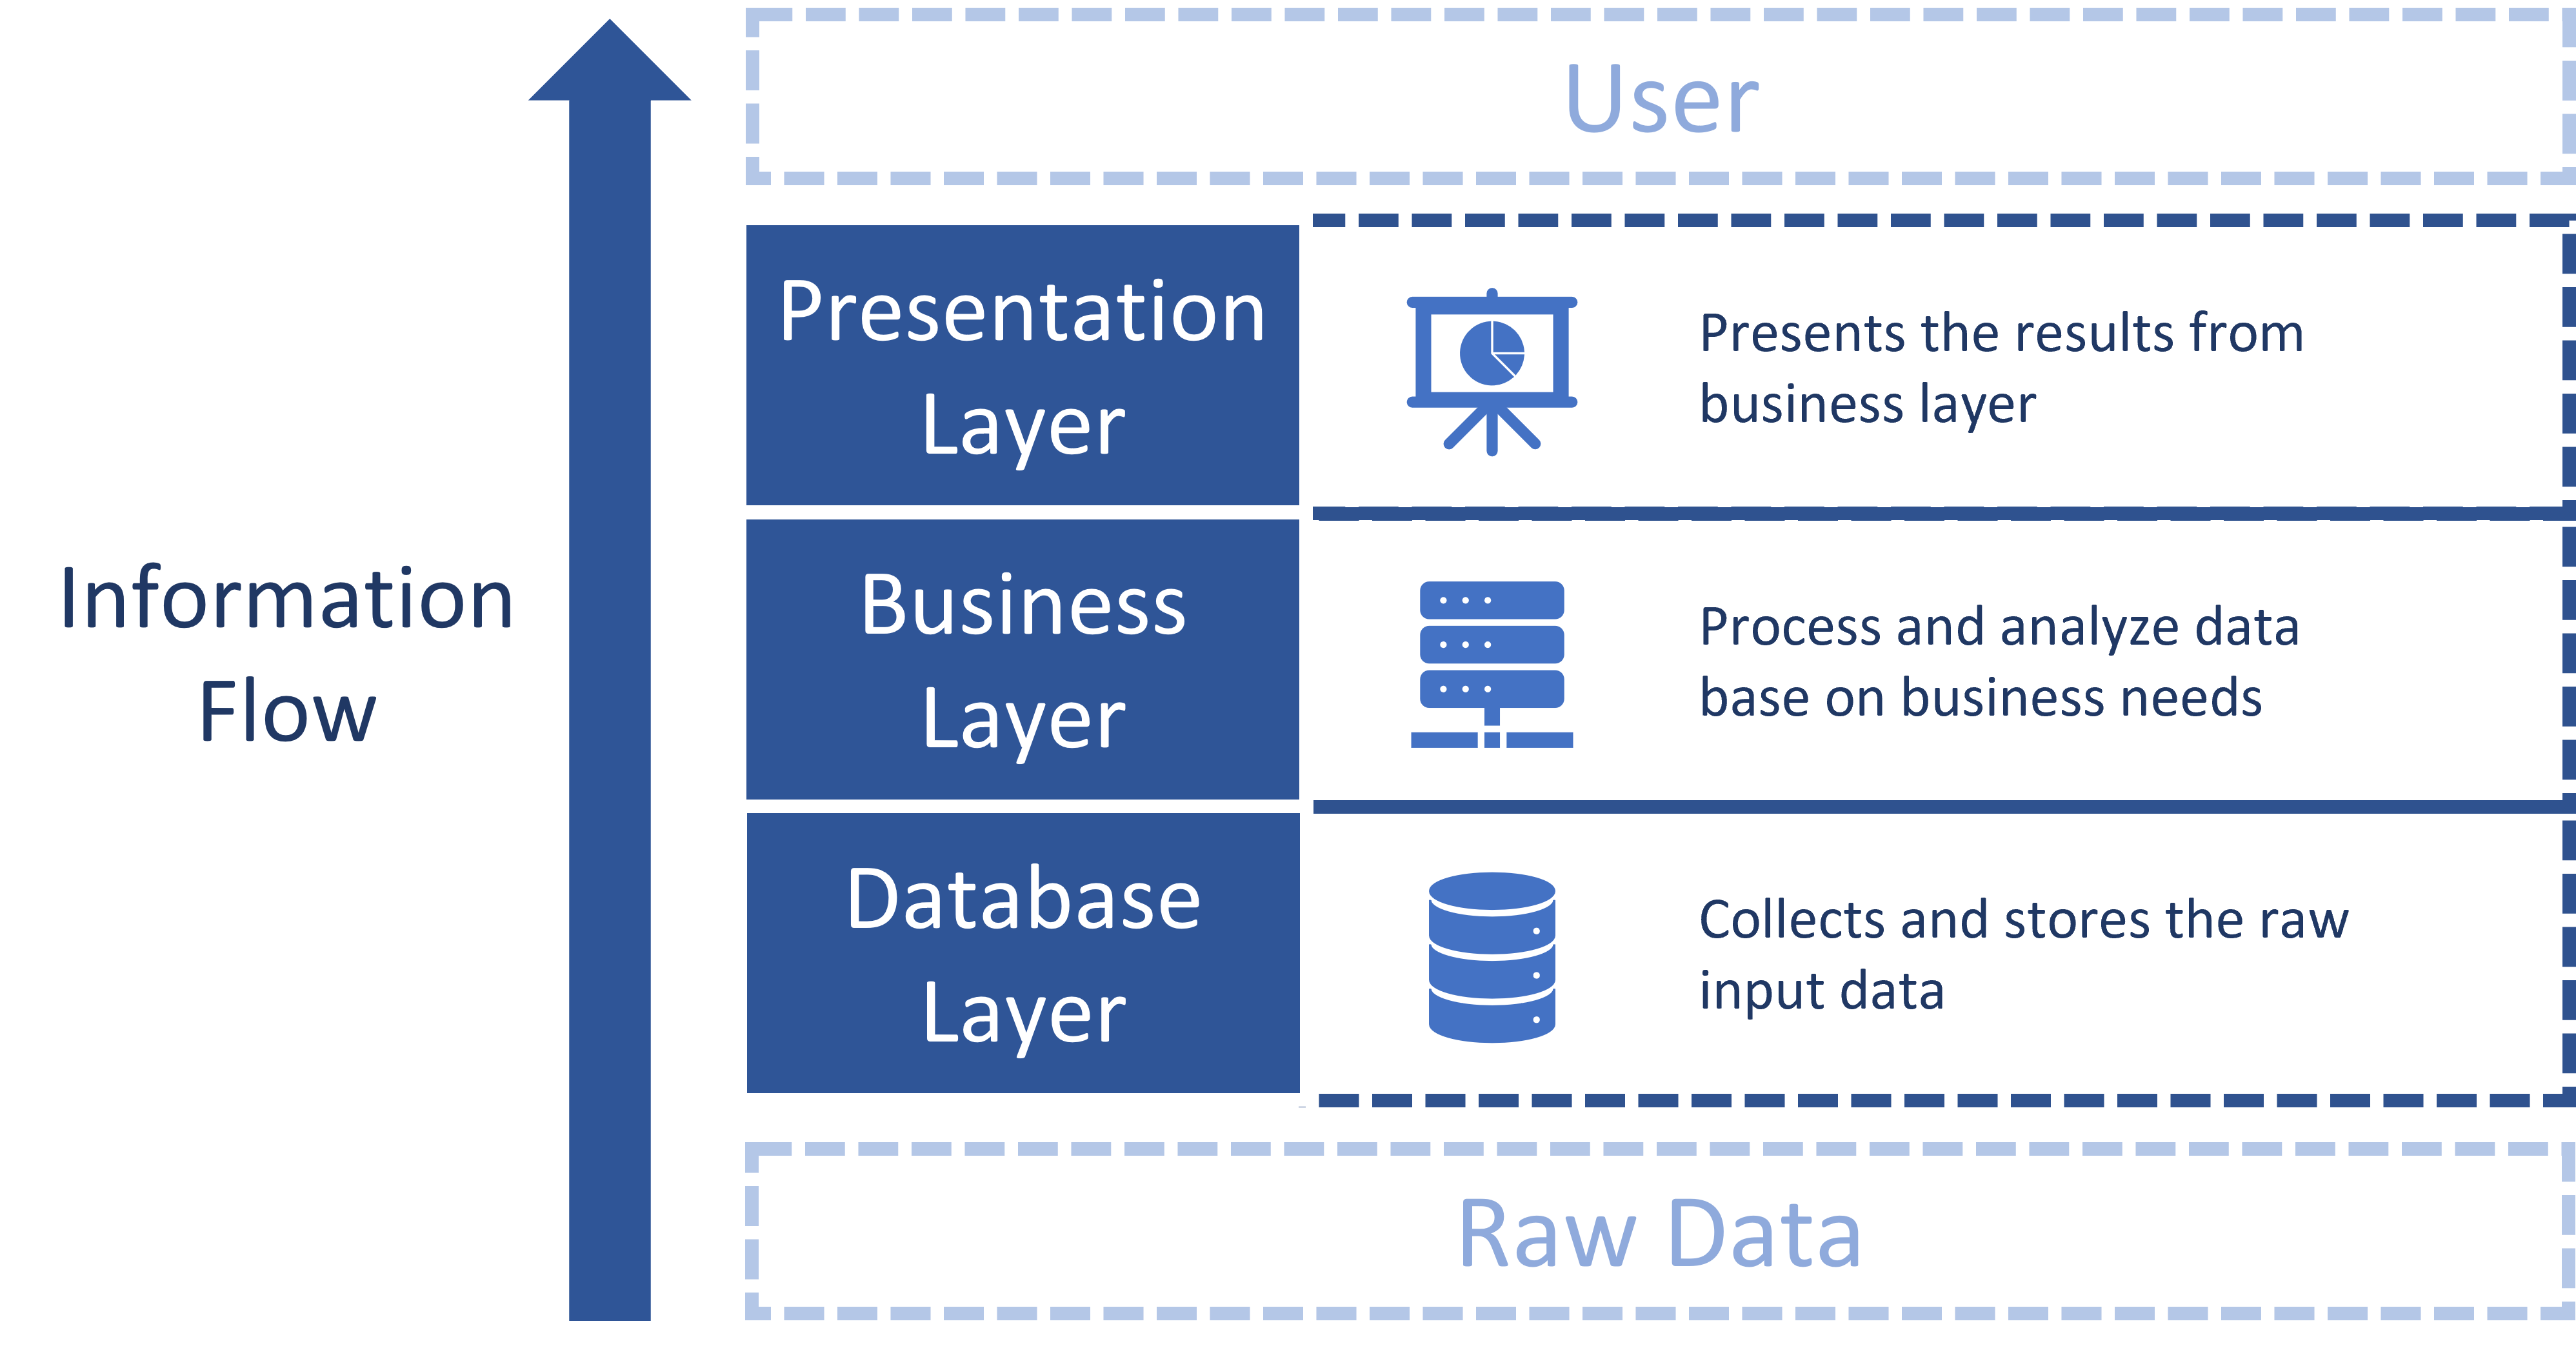
Our system design adopted the 3-level architecture of Qlik Sense and cooresponding layers with different applications were developed to form the final product. The layers are a) extract layer, b) transform layer, and c) display layer. The extract layer saves the raw data as Qlik-compatible format; the transformal layer processes and analyzes the input data, and the display layer shows the result via a interactive dashboard. The design and actions taken within each stage are pictured below. Notice that there’s an additional data acqusition stage.
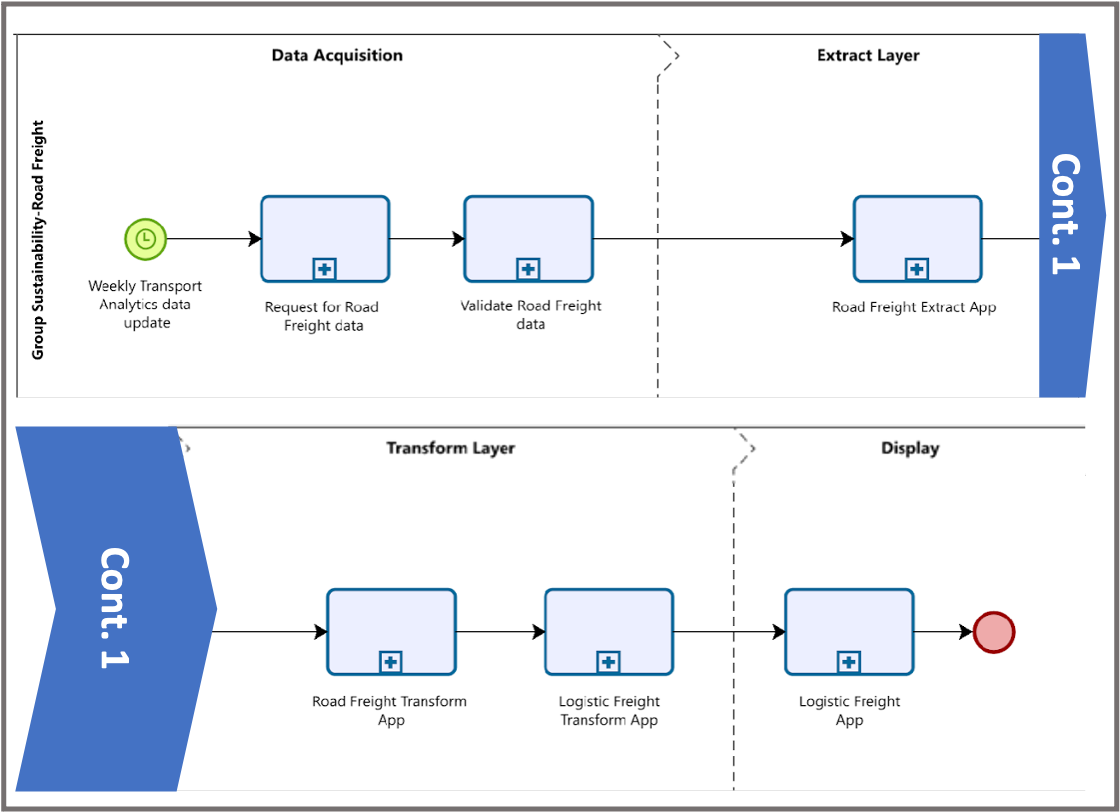
This design benefits in being able to detach the database from the user, thus preventing unauthorized access to the back end. On the other hand, this architecture is also commonly used by developers having similar data-related requirements; the fact that field experts are familiar with the layered design would benefit in maintenance and development in the future.
Interactive Dashboard
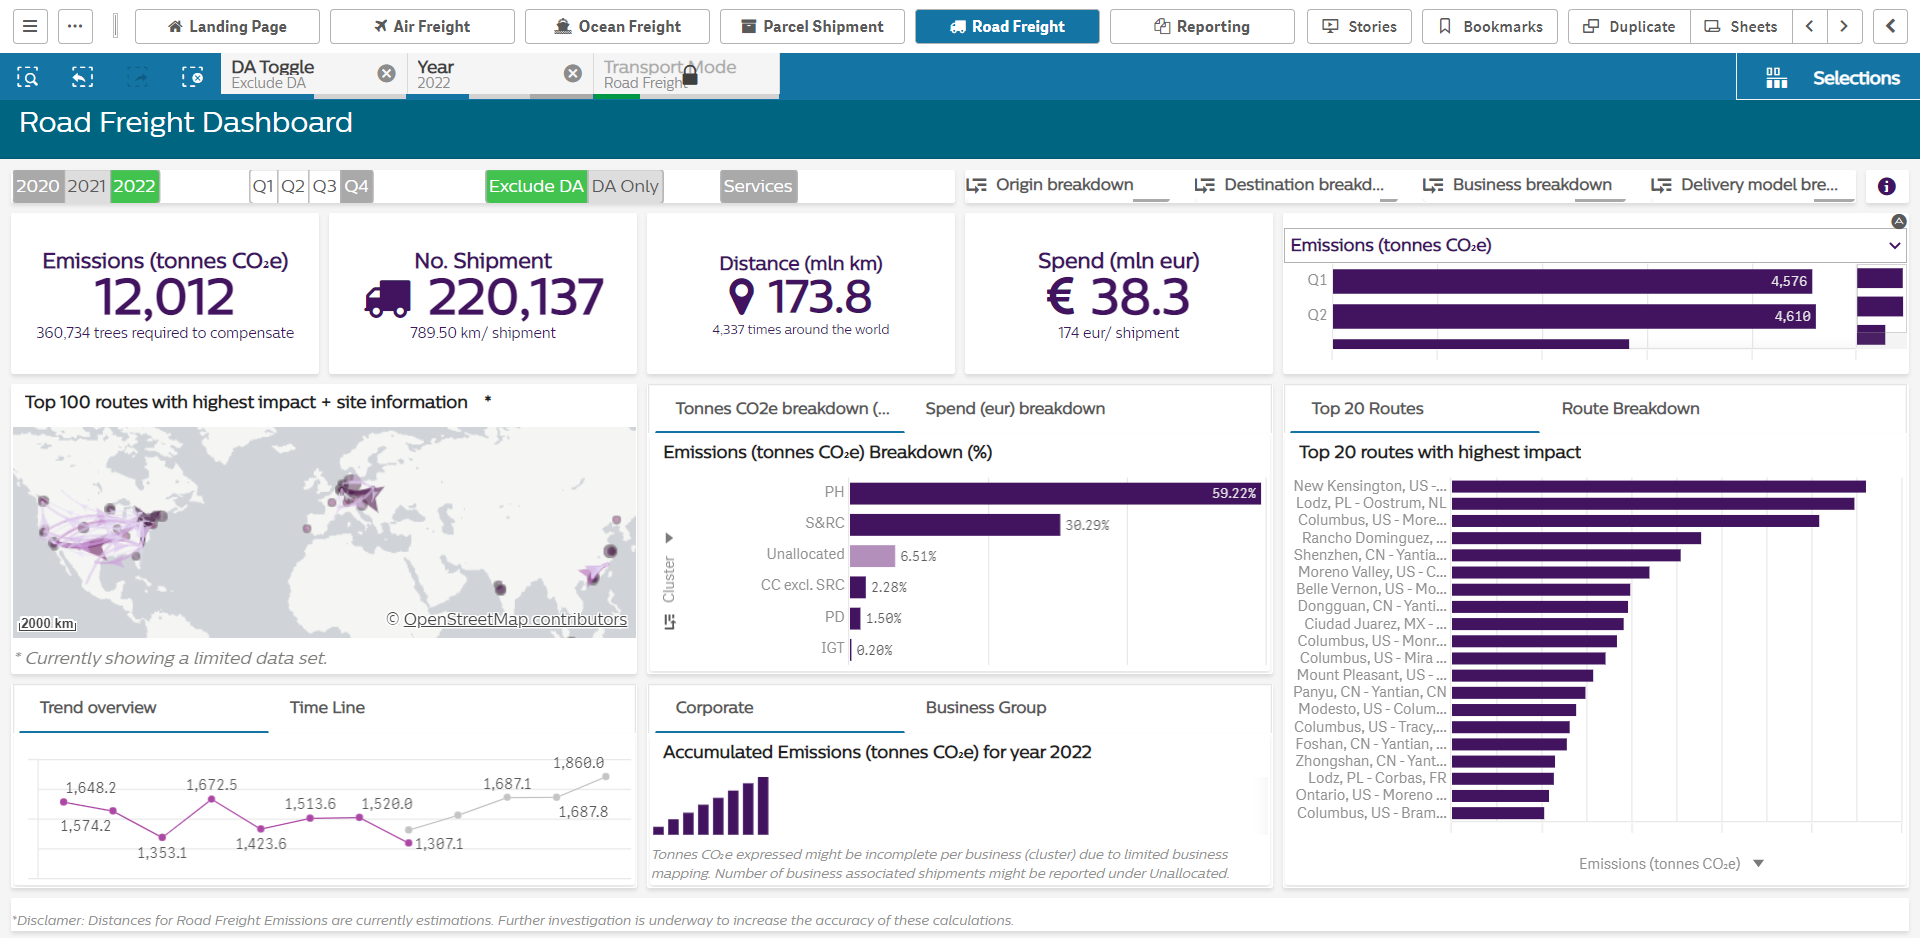
To allow for data manipulation and to serve users with various requests, we implemented an interactive dashboard to show the result, as shown below. The dashboard starts with a landing page where the most important carbon-emission-related indicators are being displayed. Within the dashboard the user can zoom in different graphs and apply a number of filters to extract the information required.
Acknowledgement
Renata Medeiros de Carvalho, Siebe Trompert, Daan Koster, Anna Kunkel, Martin van der Hop